“One of the idiosyncrasies of Windows is that directory creation may report success but create a directory with a different name, for example dir.create(“G.S.”) creates ‘”G.S”’. This is undocumented, and what are the precise circumstances is unknown (and might depend on the version of Windows). Also avoid directory names with a trailing space. Check it out in the R Documentation by typing ?dir.create() in the R console.
My favorite sudo command for Mac OS X Mavericks
In Mac OS X Mavericks, Use as Defaults is supposed to carry over to all newly opened Finder windows, but it doesn’t change any previously opened windows. If you want to revert all previously opened windows to that view, follow these steps:
Launch Terminal, copy and paste this command into the window that pops up, and hit the return key:
sudo find / -name ".DS_Store" -exec rm {} \;
At the password prompt, enter your admin password and hit the return key. When the default prompt, usually the $ sign, pops up again, quit Terminal, restart, open a Finder window, set it up the way you want, and click on Use as Defaults button. All subsequently opened or created folders should retain that view.
Microsoft’s GeoFlow for Excel is GeoTime?
http://youtu.be/LNI0r9_BJUM
On April 11th 2013, Microsoft announced a project codenamed “GeoFlow” for Excel 2013 on their Excel Blog.
GeoFlow lets you plot geographic and temporal data visually, analyze that data in 3D, and create interactive ‘tours’ to share with others. […] GeoFlow adds to the existing self-service Business Intelligence capabilities in Excel 2013, such as Microsoft Data Explorer Preview and Power View, to help discover and visualize large amounts of data, from Twitter traffic to sales performance to population data in cities around the world.
The three key points of the add-in are (1) map data, (2) discover insights, and (3) share stories. It features timeline capabilities, annotation, capturing and sharing. Sounds familiar? It does to me at least; it reminds me of GeoTime, a visual analytics product developed by the company Oculus. GeoTime was first described in 2008 by Eccles, Kapler, Harper, and Wright in a research paper called “Stories in GeoTime” in the journal Information Visualization (7, 3-17).
What do you think, has Microsoft stolen Oculus idea here?
Fusion Tables quick tutorial
Google’s Fusion Tables is “an experimental data visualization web application to gather, visualize, and share larger data tables.” One of its highlighted features is the ability to create an intensity map by merging two location data tables into one data set.
To begin, I need some data to visualize. In this example, I have downloaded the Excel file African Economic Outlook 2012 from the OECD website and copied two columns and saved it in comma-separated values (SCV) format, like this:
Country,GDP based on PPP valuation (US $ Million)
Algeria,255344
Angola,115277
…
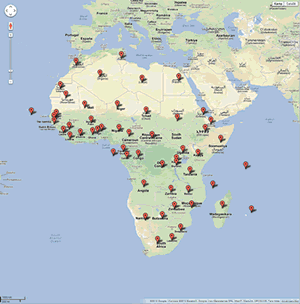
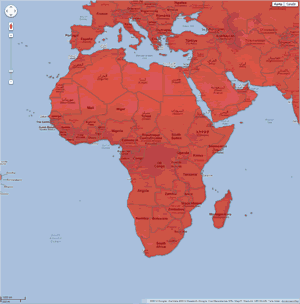
The first column Country contains country names, and the second column GDP based on PPP valuation (US $ Million) contains economic data. Fusion Tables geocodes the country column for me, and the result is a map with markers for each of the countries (map 1). I can click on each marker and get information about the country and its GDP. The next step is to download the file world country boundaries and import it into Fusion Tables. This table contains polygon boundaries for all countries in the word (map 2).
| Map 1: African countries and their GDP | Map 2: World country boundaries |
|---|---|
 |
 |
In the final step, I merge these two tables to generate a single visualization that includes both sets of data. To find the story in the data, I apply a gradient green fill color to the GDP column. The map tells us that Egypt, South Africa and Nigeria are the top three largest economies on the continent in the year 2011. We can also see that Western Sahara and Somalia are missing data by their reddish color.
Installation of Microsoft Word plugin in Mendeley
I recently installed the free reference manager Mendeley. The desktop application is great so far with many nice features such as collaboration, a web app, iPad app, and a citation plug-in for Microsoft Word. However, when I tried to install the MS Word plugin on my computer, running a 64-bit Windows 7 Professional operating system and Microsoft Word 2010, the plug-in would not show up in the ribbon under References as “Mendeley Cite-O-Matic”.
I searched the Mendeley support forum and found out that I was not alone having a problem with the automatic installation of the MS Word plug-in from the Tools menu. The solution for me was a slight modification of one of the Mendeley agent’s suggested solutions:
1) Install MS Word plugin from the Tools menu in Mendeley Desktop.
2) Browse to C:\Users\[YourUserProfile]\AppData\Roaming\Microsoft\Word\Startup
(The path might be slightly different on your machine. Remember also that the AppData folder is hidden. To make this folder visible, click Organize in the window toolbar -> Folder and search options -> View tab -> Hidden files and folders -> Show hidden files, folders, and drives)
3) Copy the file Mendeley-1.7.1.dotm
(Alternatively, you may also find this file in the C:\Program Files (x86)\Mendeley Desktop\wordPlugin folder)
4) Browse to C:\Users\[YourUserProfile]\AppData\Roaming\Microsoft\Word\Autostart
5) Paste the file in the root of the folder.
6) Done!
The solution was to put the global template Mendeley-1.7.1.dotm in the Autostart folder instead of the Startup folder, which seems to be the normal folder for global templates from what I have read.
Please comment and let me know if this was helpful to you.
Cheers,
Samuel


